How RONR works
RONR is a personal running dashboard. It reads the runs from your GPS watch and answers one question every week: is my aerobic base growing, without getting hurt? You never log anything by hand. Just run, then check in here.
Start here
Three steps, in this order.
- 1
Get your runs in
On the Runs page, click Sync Intervals.icu to pull runs from Garmin or Strava, or Upload GPX / FIT to add files from your watch. The demo already has runs loaded.
- 2
Open one run
Click any run for its route, weather and Deep Dive: heart rate, pace and elevation through the run. Ask: was the effort what I meant it to be?
- 3
Check the trends weekly
Open Analysis once a week. Each chart has a ? that brings you back here to explain it.
The idea behind the app
The best predictor of long-term running success is a strong aerobic base, built consistently and without injury. Speed comes from the base, not instead of it. Everything in the app serves three questions:
- Is my aerobic engine improving? If your heart rate at a given pace drifts down over the months, it is.
- Am I training at the right intensities? Most runs should be genuinely easy. The most common mistake in distance running is running easy days too hard.
- Am I building load safely? Injuries usually come from ramping up faster than the body can adapt, and that ramp is measurable before it hurts you.
Key terms
Words you’ll see across the app.
- Aerobic base
- Your ability to run far at a low, comfortable effort. Speed is built on top of it.
- MAF
- Your aerobic ceiling: 180 − your age, in beats per minute. At or below it counts as easy.
- Zone 2
- The 10 beats just below MAF. A genuinely easy, conversational effort.
- Hard
- Heart rate at or above 87% of your max (220 − age, or your highest recorded if higher).
- TRIMP
- A training-stress score per run: minutes × how hard your heart worked. Hard minutes count extra.
- Fitness / Fatigue / Form
- Your 42-day load (CTL), 7-day load (ATL), and the difference between them (TSB).
- Load ratio
- This week’s load ÷ your 6-week base. 0.8–1.3 is a safe build.
- Segment
- A stretch of road many of your runs share, timed on every pass.
Heart-rate zones use the birthday in Settings, at your age on the day of each run, so last year’s runs keep last year’s zones. Without a birthday, the app uses shares of your highest recorded heart rate.
The pages
A quick tour, in the order of the menu.
Runs
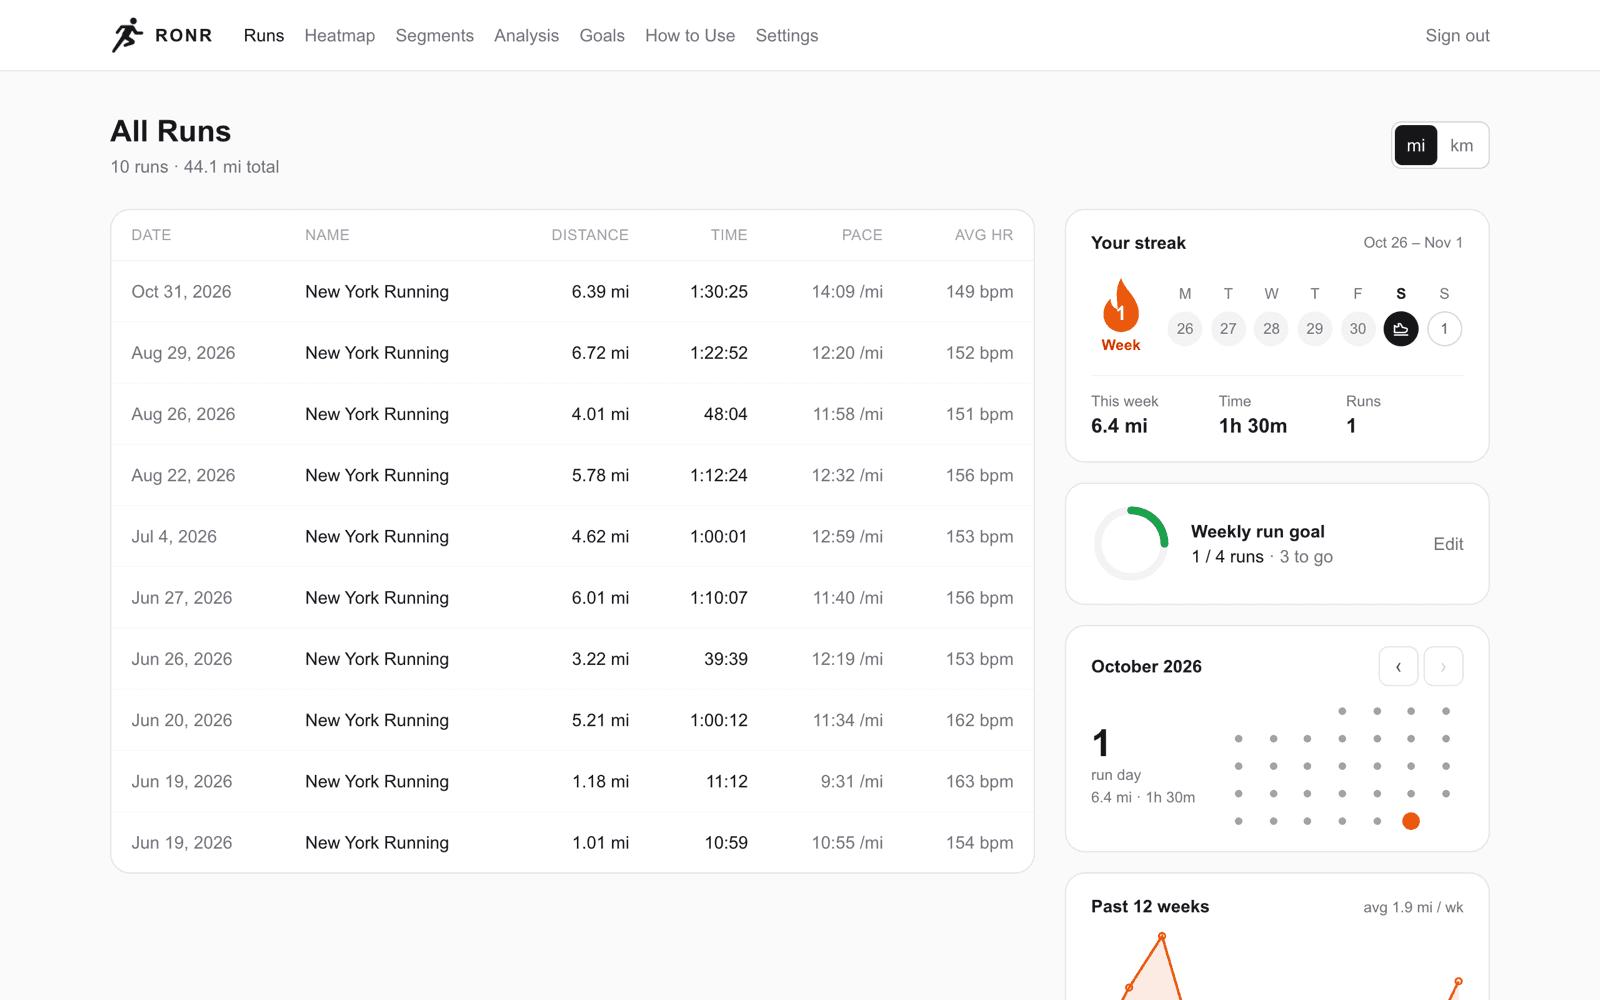
Open →The log: every run with date, distance, time, pace and heart rate. Switch miles and kilometers at the top. This is also where you sync or upload new runs.
The sidebar checks whether the habit is holding. The flame is your streak of Monday–Sunday weeks with at least one run; rest days never break it. Below it: your weekly goal ring, a month calendar of run days, and distance for the past 12 weeks.
Run detail & Deep Dive
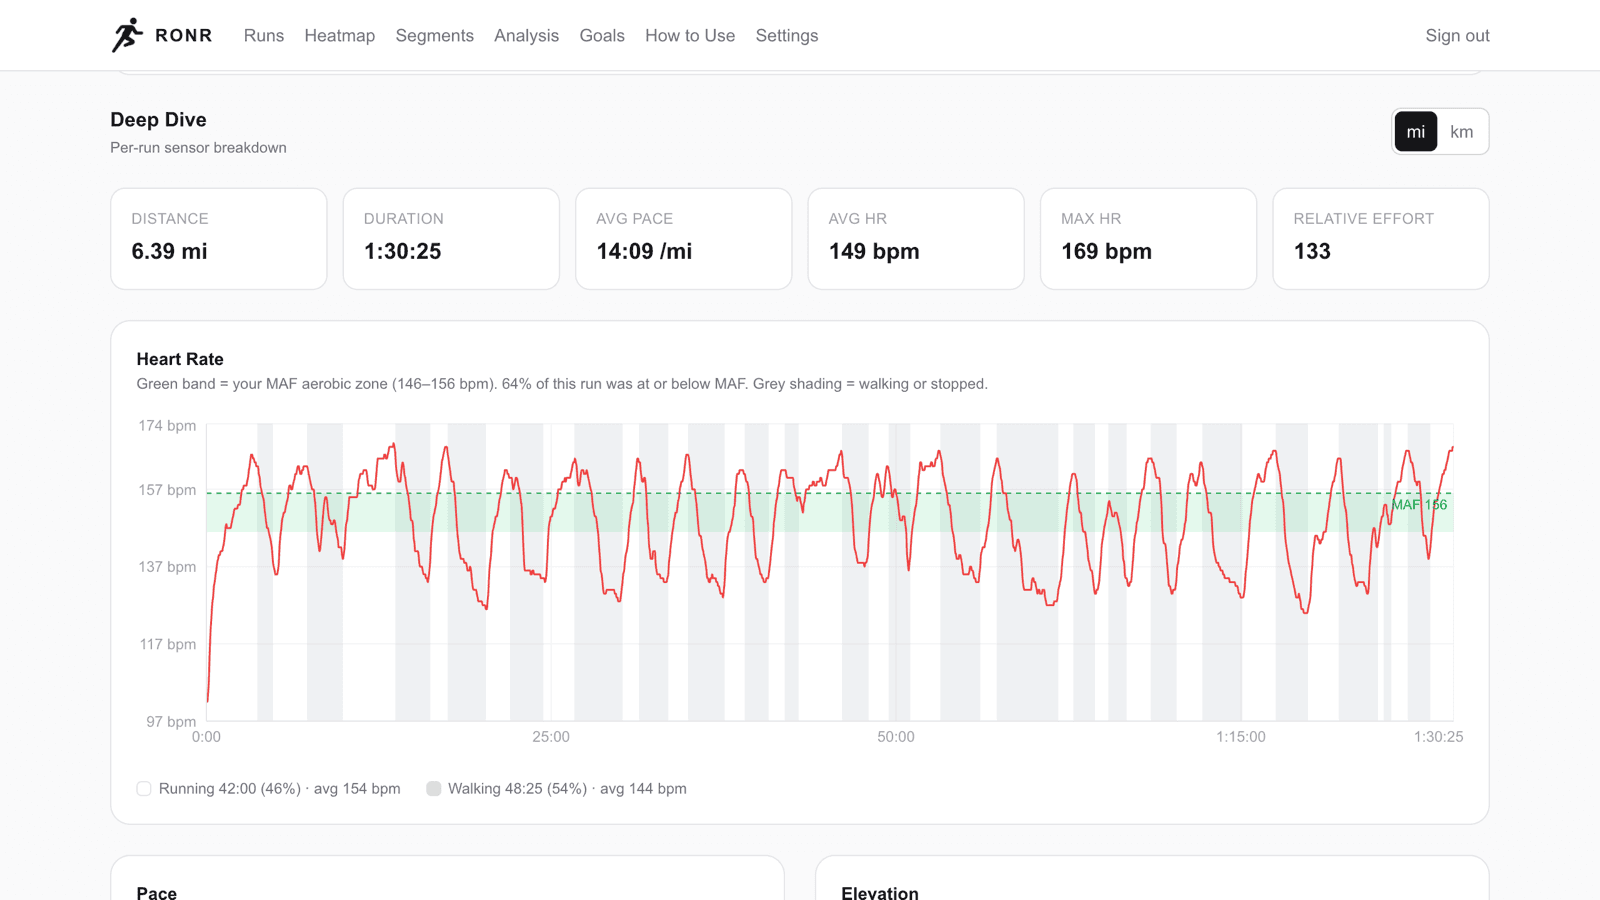
Open →Click any run to see its route (green start, red finish) and the weather when you ran. The Deep Dive below tells the run’s story second by second:
- Heart rate with your MAF band in green. Grey shading marks time spent walking or stopped.
- Pace (with grade-adjusted pace for hills), elevation and cadence.
- Time in zones: how the run split between easy, moderate and hard.
- Splits per mile or km, and any segments the run passed through.
Heatmap
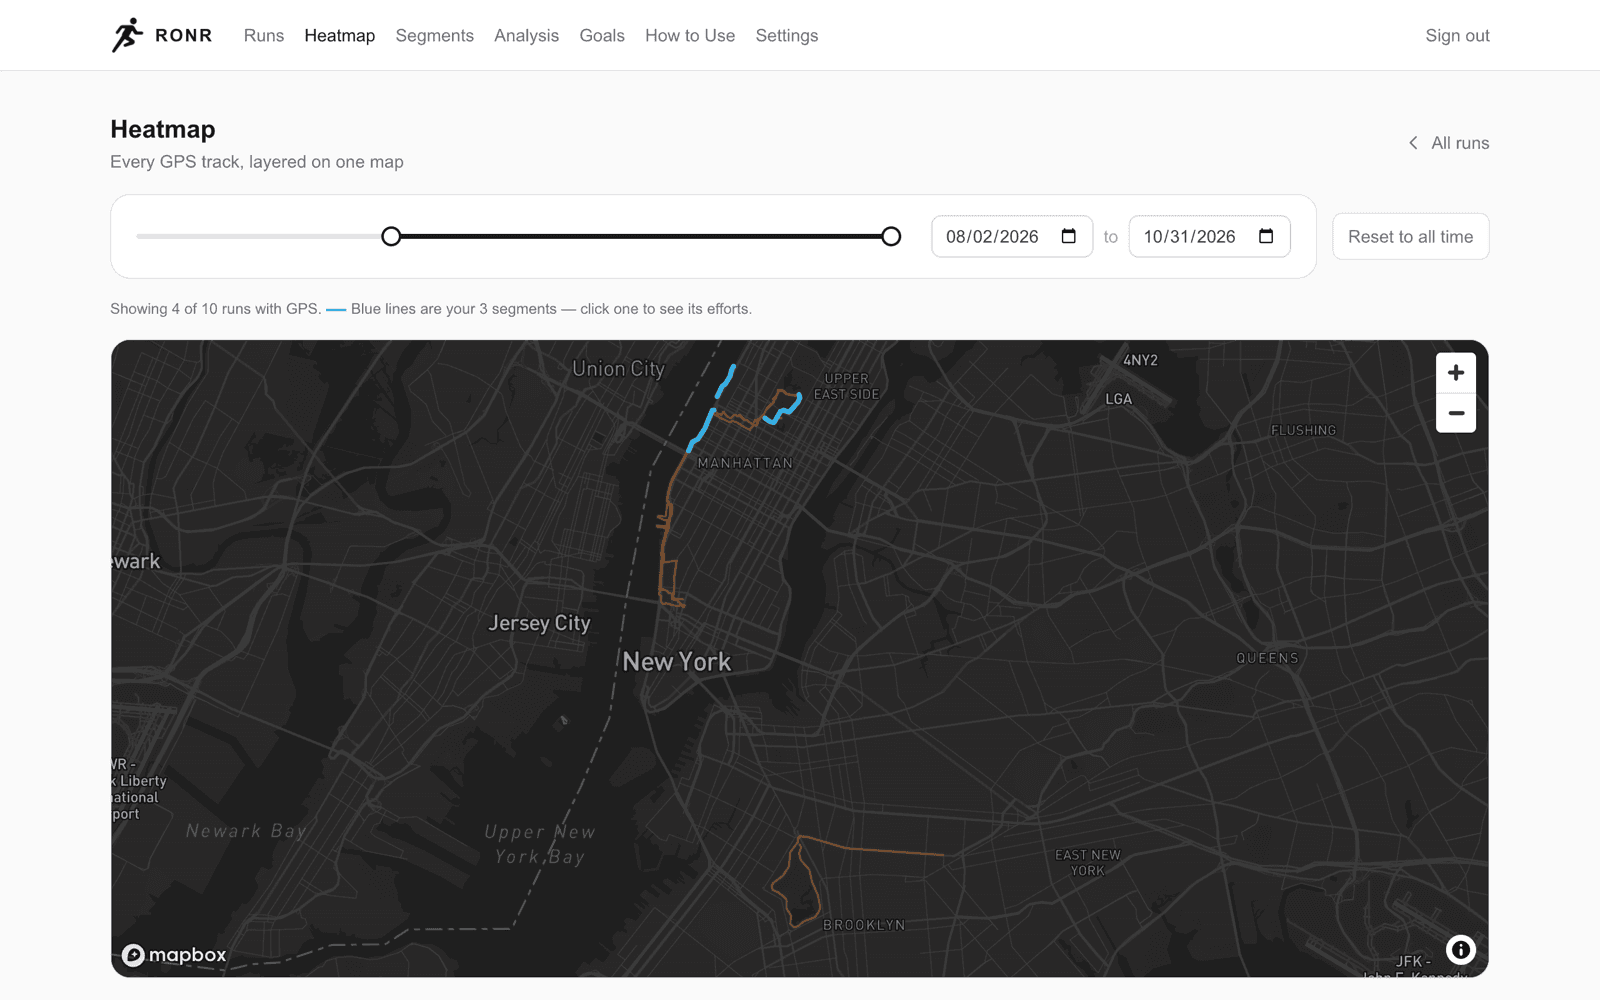
Open →Every GPS track layered on one dark map; routes you run often glow brighter. It opens on the last 90 days around your most recent run, wherever that was. Drag the date slider to change the range, or click Reset to all time. Blue lines are your segments; click one to jump to it.
Segments
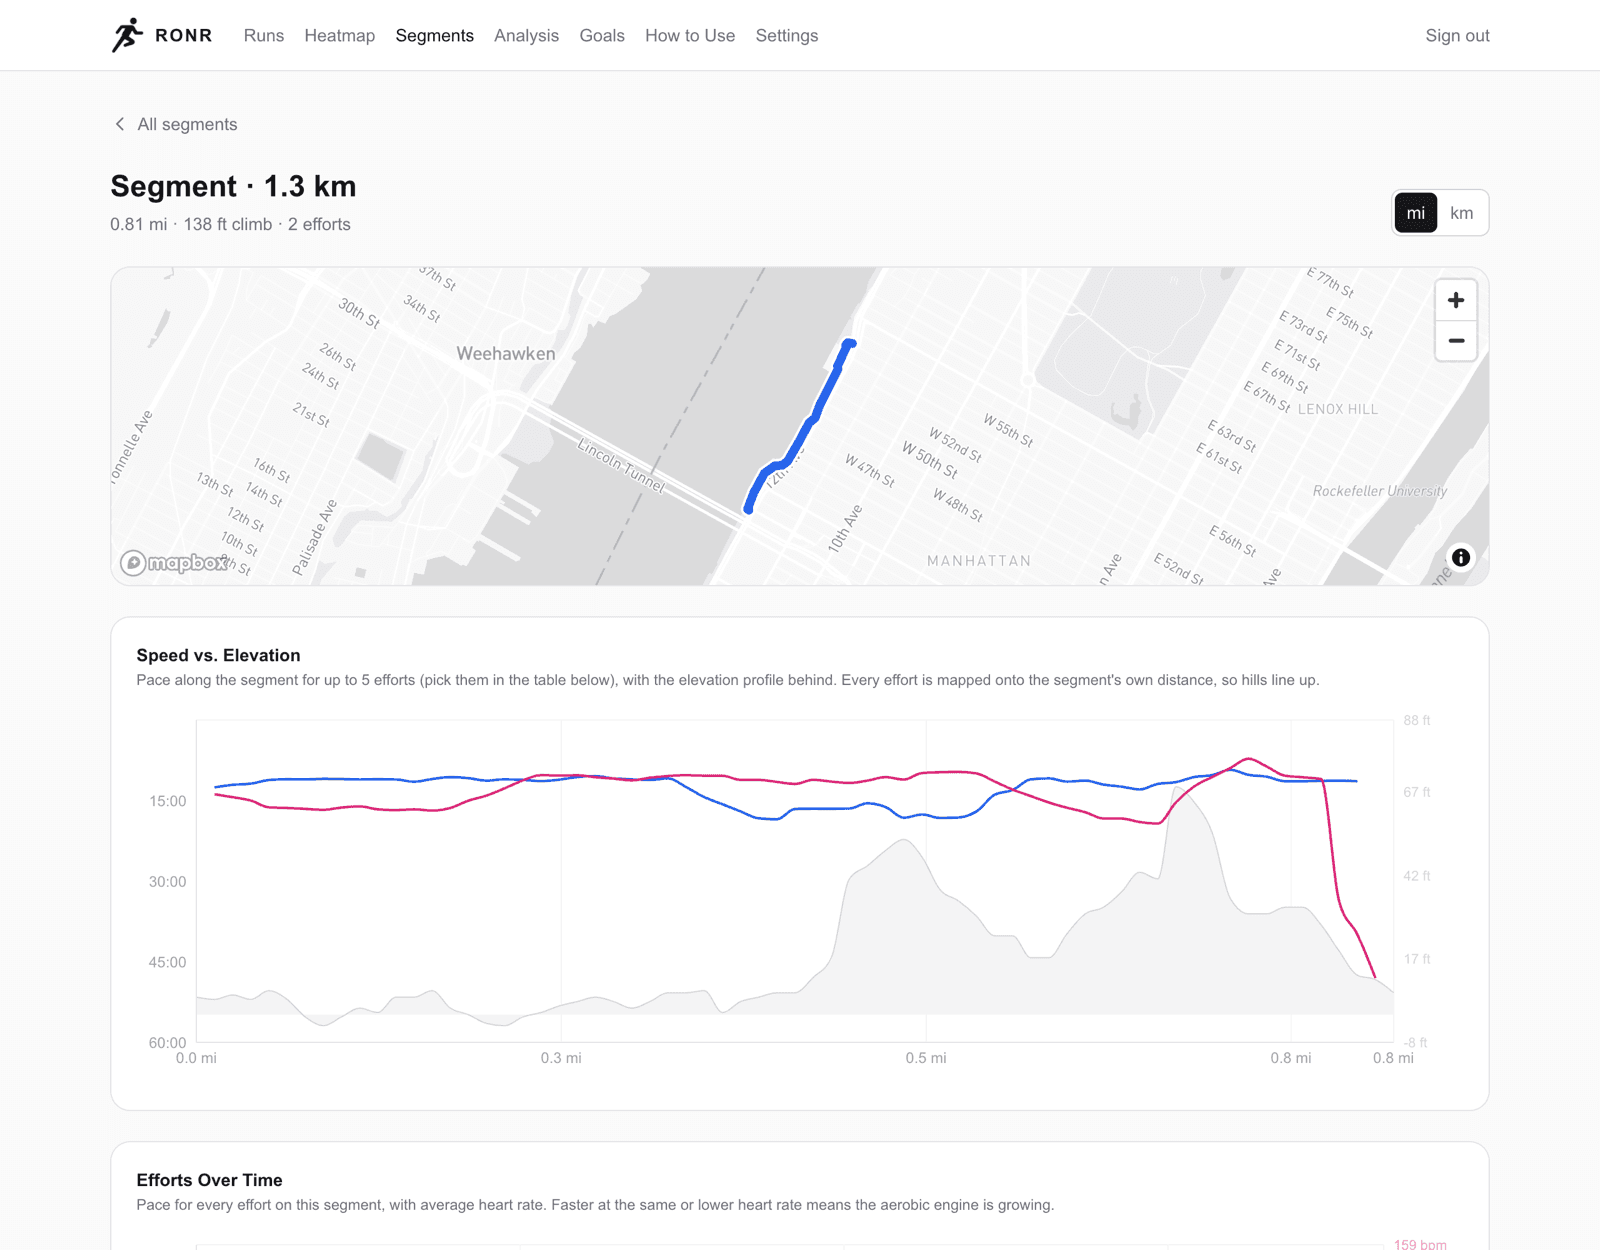
Open →The stretches you run most, even inside different routes. The app finds them by overlaying all your runs and spotting where many share the same path, then times every pass. Open a segment to see whether you’re getting faster at the same heart rate, and compare up to five efforts drawn over the hill profile.
Analysis
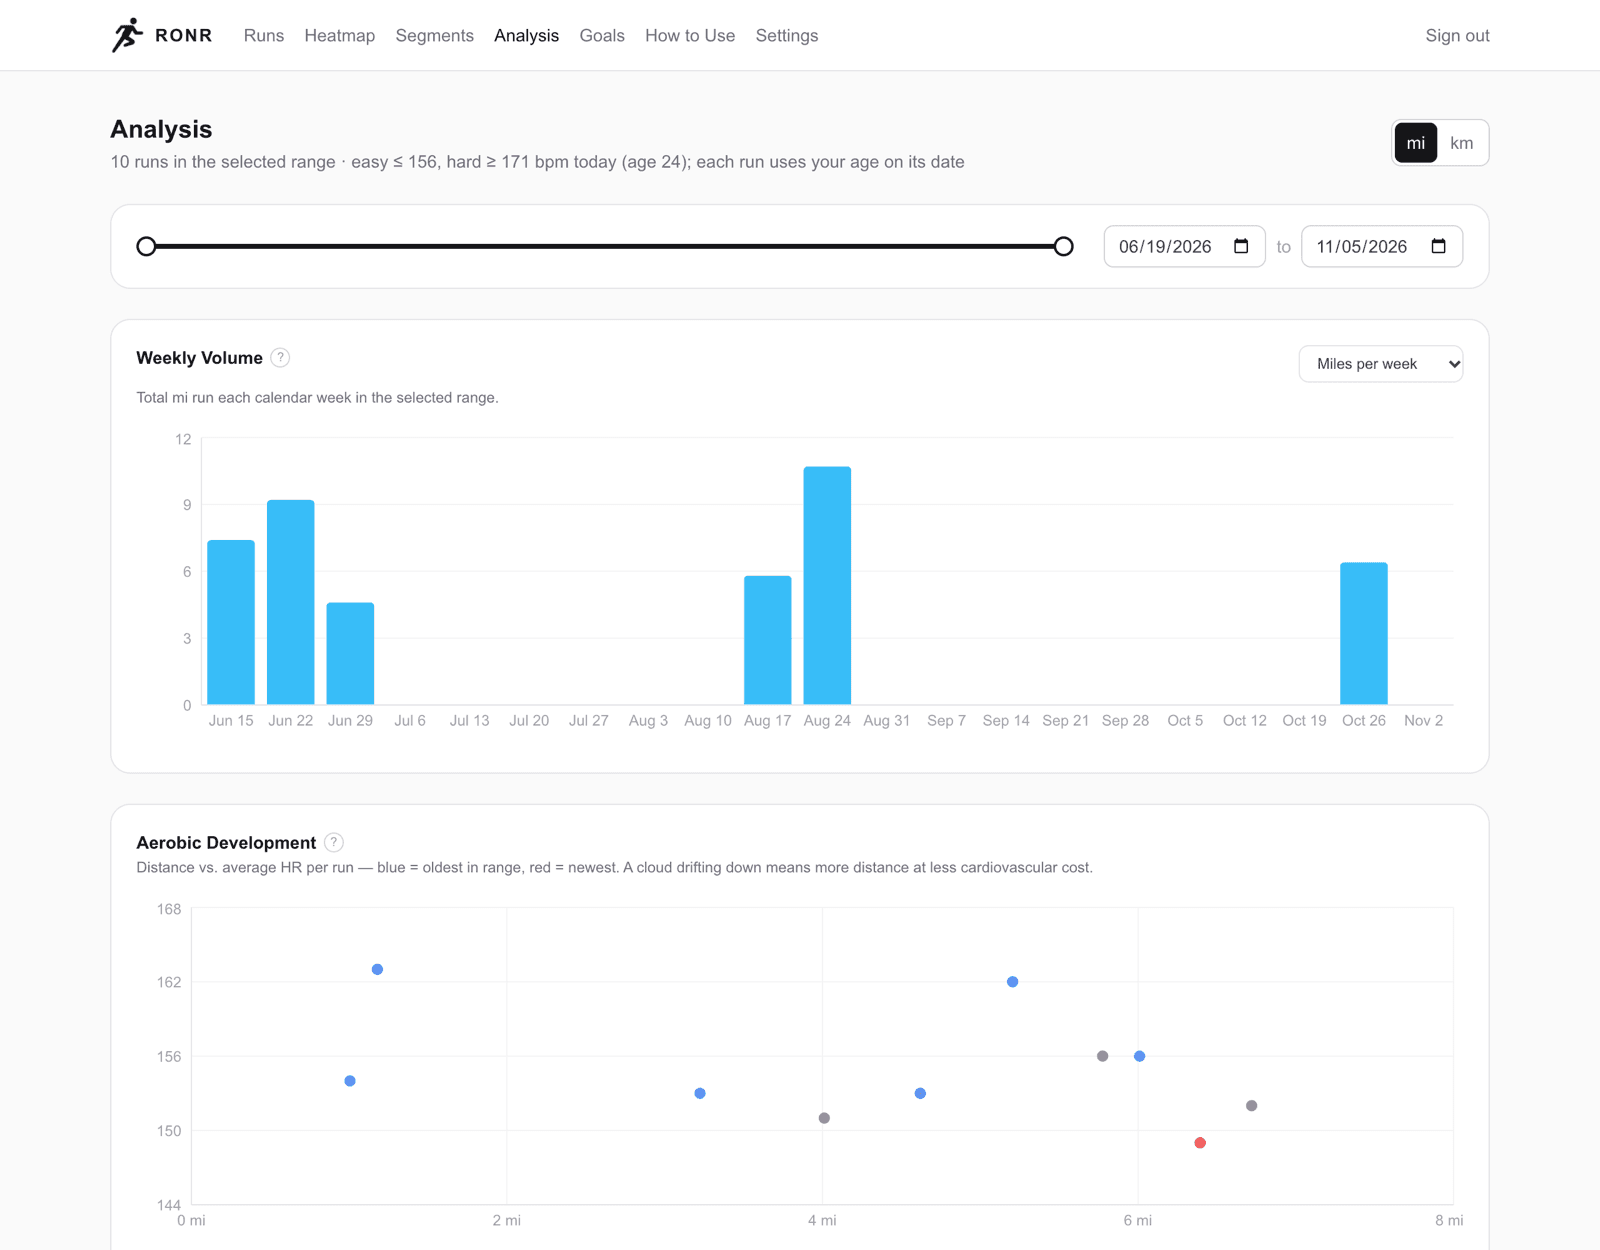
Open →Trends across many runs. The date slider at the top drives most charts (it starts at the last two weeks); the training-load charts at the bottom always use your full history. Every chart is explained below.
Goals
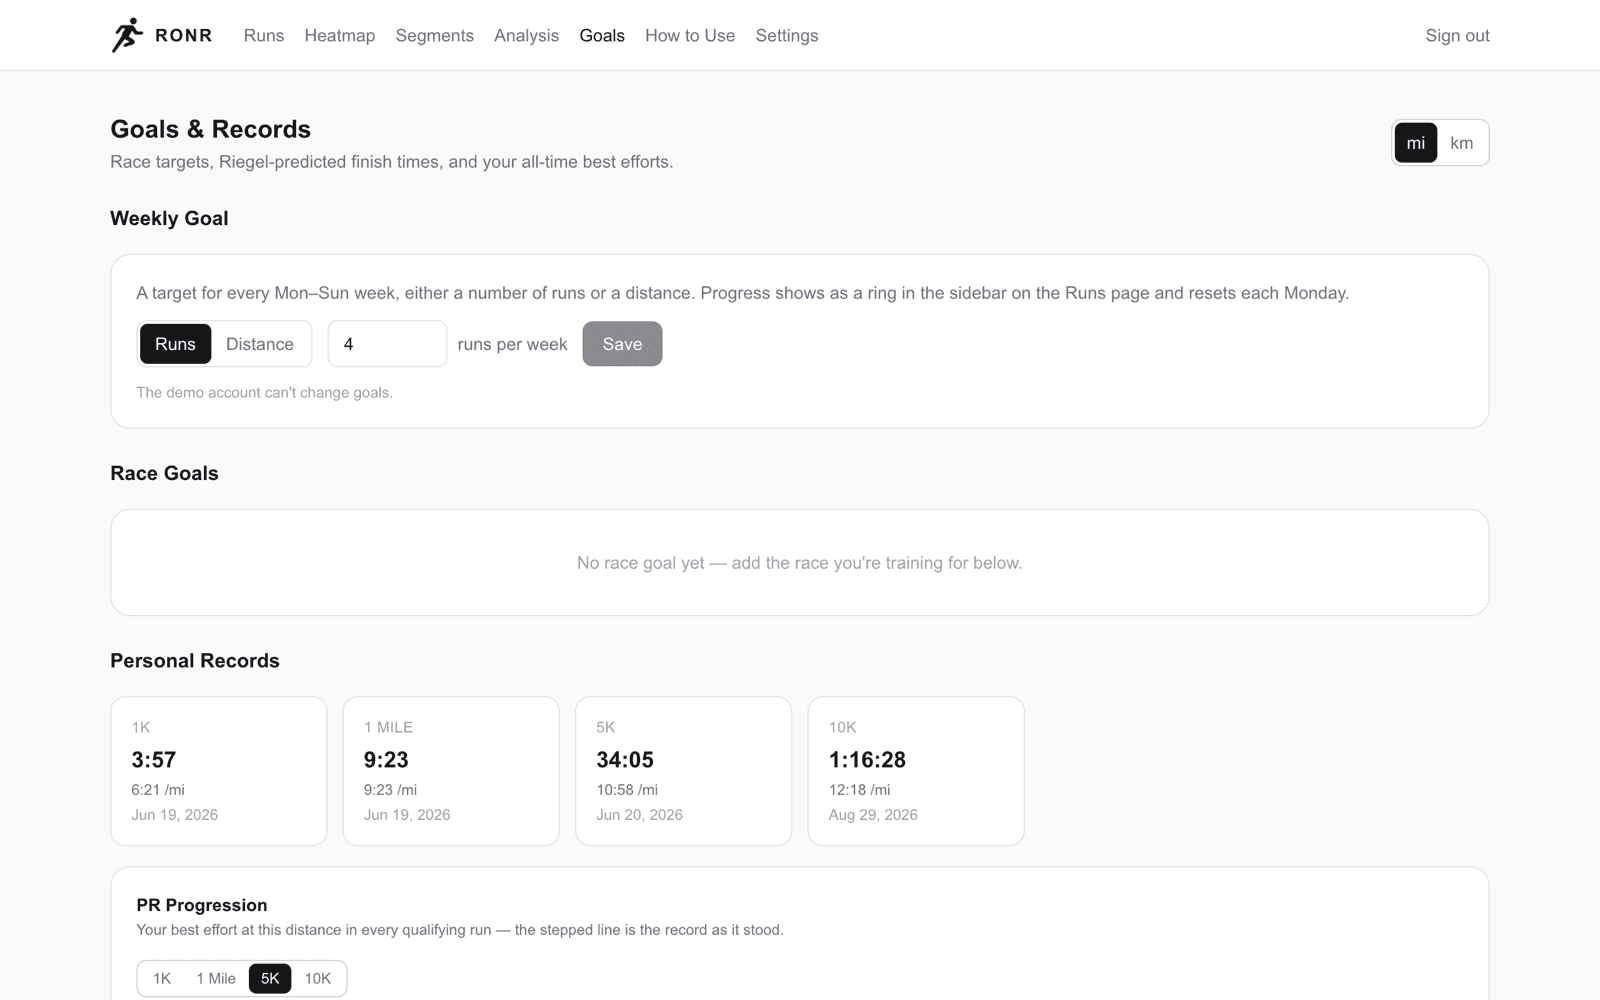
Open →Set a weekly goal (a number of runs or a distance) and race goals. For each race the app predicts your finish time from recent best efforts. Personal records from 1K to the marathon are found in your runs automatically.
Settings
Open →Your birthday (which sets your heart-rate zones), the time zone used for days and weeks (Eastern unless you change it, so a late-evening run counts on the day you ran it), and your login history.
Analysis charts
Click a chart to expand it. The green tag is what a good reading looks like.
Volume & consistency
Weekly VolumeWant: steady, gentle growth
Total distance, run count or average run length per calendar week. Fitness follows volume, and volume should grow gradually: the classic guideline is no more than about 10% a week. Look for consistency first, growth second.
Long Run ProgressionWant: stair-steps, no spikes
The longest single run of each week over the last 16 weeks, the length of a typical marathon build. You want stair-step growth with occasional cut-back weeks, not a flat line and not a sudden jump.
Aerobic engine
Aerobic DevelopmentWant: newer dots lower
Every run as a dot: distance across, average heart rate up, colored blue (oldest) to red (newest). Newer, redder dots sitting lower than older ones at the same distance means the same work costs your heart less. That downward drift is aerobic fitness. Dots drifting upward point to fatigue or too much hard running.
Aerobic EfficiencyWant: rising line
Meters per minute, per heartbeat: how much speed each heartbeat buys you. Rising means improving. Expect noise from run to run; judge the slope over weeks, not days.
Aerobic PaceWant: rising line (faster)
The average pace of your easy (Zone 2) runs only, with the axis flipped so up is faster. It leaves out workouts and races, so it isolates your cruising speed at low effort, the number that best predicts marathon potential.
Intensity
Effort DistributionWant: ≥ 75% easy
Each week’s running time split into easy, moderate and hard, in hours or as a percentage. Time is classified second by second from heart rate, so an easy warm-up with a hard finish is split correctly. Roughly 75–80% of running should be easy. A thin green band usually means easy runs are being run too hard.
Form & conditions
Running FormWant: steady or slowly rising
Cadence (steps per minute) and step length; speed is the two multiplied. Dots are runs, the line is a 28-day average. It defaults to easy runs only, so like is compared with like. A slowly rising cadence at the same effort is a good sign; a sudden drop in either can point to fatigue or a niggle.
Run / Walk SplitWant: running share creeping up
Each run’s full elapsed time classified from cadence and speed as running, walking or stopped, with a 28-day running share line. Warm-up and cool-down walks count as breaks; stops like traffic lights stay in. Alongside it, the longest continuous stretch of running. Useful when building up with run/walk intervals.
Performance vs. WeatherWant: know your heat cost
Aerobic efficiency against the feels-like temperature, with darker dots for muggier air (higher dew point). Heat and humidity slow everyone; this shows your cost, so a “slow” August run can be read as the strong effort it was.
Load & readiness (full history)
Fitness & FatigueWant: fitness rising, fresh for races
Daily TRIMP drives three curves: Fitness (42-day average load) builds and fades slowly, Fatigue (7-day) spikes and fades fast, and Form is fitness minus fatigue. Negative form is normal while building; for a race you want fitness high and form positive. That’s what a taper is for.
Acute : Chronic LoadWant: 0.8 – 1.3
This week’s load divided by your 6-week base: am I ramping up faster than my body can absorb? 0.8–1.3 is a sustainable build. Above 1.3, ease off soon; above 1.5 is the zone most linked to injury. Below 0.8 is recovery or taper, fine when it’s on purpose.
Next 7 daysWant: follow it, keep it easy
A suggested week of easy runs built from your recent training. It grows last week by about 10%, takes a cutback week (75%) after three builds in a row, and after a break of a week or more ramps back in at 50 → 75 → 90 → 100% of what you were doing before. It is trimmed so the projected load ratio stays at or below 1.3, and never drops below a minimum week of three 30-minute runs.
Every run is easy, under your MAF heart rate; walk when you need to stay under it. Open How this was set on the card to see the arithmetic.
A simple weekly routine
After each run
Open its Deep Dive. Was the effort what you intended?
Once a week
Open Analysis. Enough easy (Effort Distribution)? Ramping safely (Acute : Chronic)? Consistent (Weekly Volume)?
Once a month
Widen the date range and look at Aerobic Efficiency and Aerobic Pace. Is the engine growing?
If the answers are yes, keep going. Patience is the whole game.